3.1. GSI Editor
The GSI Editor is a tab-based tool for viewing, editing, and converting Leica GSI survey data files. It provides a decoded, human-readable grid view of the binary-style GSI format, making it straightforward to inspect and modify field measurements before further processing.
3.1.1. Overview
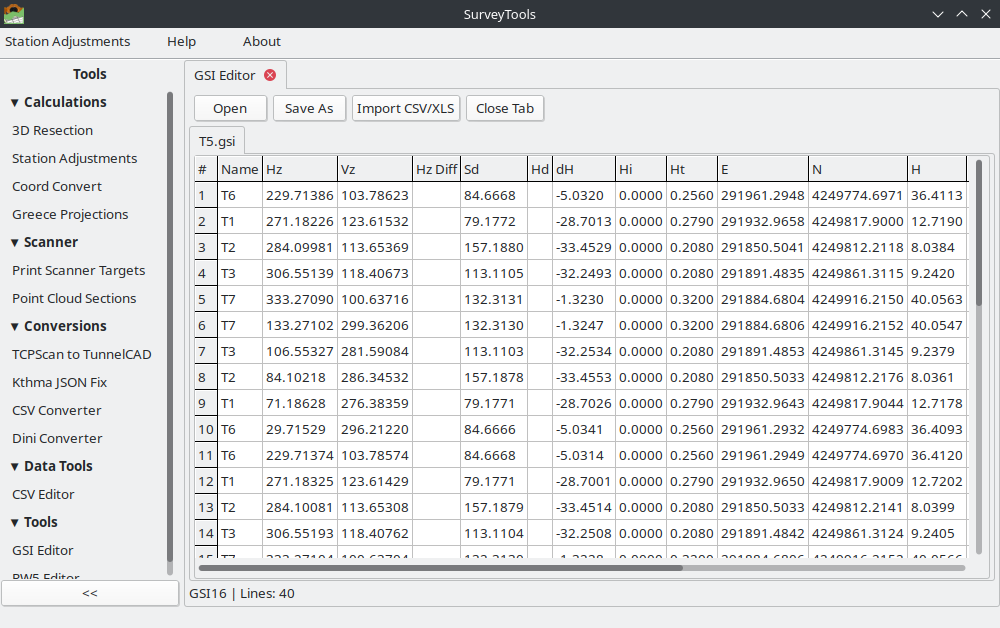
The GSI Editor supports:
Opening multiple GSI files simultaneously in separate tabs
Viewing decoded GSI data in a 24-column grid covering all standard Word Index codes (WI 11–88)
Editing field values with real-time validation (angle range 0–400 gon, distance >= 0, point name length limits)
Saving and exporting to GSI8, GSI16, XLSX, and CSV formats with automatic file extension
Importing measurement data from CSV or XLSX spreadsheets via a 3-step column mapping wizard
Visual row coloring: station setup lines (light blue), set-of-angles result lines (light gray)
Invalid cells highlighted in red for quick identification of data problems
Auto-detection of GSI8 vs GSI16 format on file open
3.1.1.1. Leica GSI Format Reference
3.1.2. Overview
GSI (GEO Serial Interface) is an ASCII text format used by Leica total stations (TPS series) and digital levels (DNA series). Each line in a GSI file represents one measurement or station record, composed of space-separated data words.
Two format variants exist:
GSI8 – 8-character data portion (15 characters per word total)
GSI16 – 16-character data portion (23 characters per word total)
The first word on each line starts with an asterisk (*) to mark the beginning
of a new record.
*110001+0000000000000101 21.022+0000000009521400 22.022+0000000009876300 31..00+0000000000125340
*110002+0000000000000102 21.022+0000000012345600 22.022+0000000010012500 31..00+0000000000098760
3.1.3. Word Structure
Each data word in GSI16 format is exactly 23 characters long. In GSI8 format, each word is 15 characters long. The structure is identical; only the data portion length differs.
Position |
Name |
Description |
|---|---|---|
1–2 |
Word Index (WI) |
Two-digit code identifying the data type (see Word Index Table below) |
3 |
Auto-index info |
|
4 |
Input mode |
|
5 |
Additional info |
Instrument-specific additional information |
6 |
Units indicator |
Specifies the measurement unit and decimal precision (see Units table) |
7 |
Sign |
|
8–23 |
Data |
16-character zero-padded numeric value (8 characters in GSI8) |
Note
The leading asterisk (*) that marks the first word of each line is not counted
in the 23-character word length. The parser strips it before decoding.
3.1.4. Units Indicator
Position 6 of each data word encodes the measurement unit and implied decimal precision:
Code |
Unit |
Decimals |
Description |
|---|---|---|---|
0 |
Meters (mm) |
3 |
Millimeter resolution |
1 |
US Feet (1/1000 ft) |
3 |
Thousandths of a foot |
2 |
Gradians (gon) |
5 |
400 gon = full circle |
3 |
Degrees (decimal) |
5 |
360 degrees decimal |
6 |
Meters (1/10 mm) |
4 |
Sub-millimeter resolution |
8 |
Meters (1/100 mm) |
5 |
High-precision distance |
3.1.5. Word Index Table
The Word Index (WI) is the two-digit code at positions 1–2 of each data word. It identifies what type of data the word contains.
WI |
Name |
Description |
|---|---|---|
11 |
Point Number |
Target point name or identifier |
12 |
Serial Number |
Instrument serial number |
13 |
Instrument Type |
Instrument model identifier |
16 |
Station Point Number |
Station (instrument) point name |
17 |
Date |
Date stamp of measurement |
18 |
Time format 1 |
Year, seconds, milliseconds |
19 |
Time format 2 |
Month, day, hour, minute |
21 |
Hz Angle |
Horizontal circle reading (gradians) |
22 |
Vz Angle |
Vertical/zenith angle (gradians) |
25 |
Hz Circle Diff |
Horizontal circle difference |
31 |
Slope Distance |
Slope distance (meters) |
32 |
Horiz Distance |
Horizontal distance (meters) |
33 |
Height Diff |
Height difference (meters) |
41 |
Code Number |
Code block number |
42–49 |
Info 1–8 |
General information fields |
51 |
PPM/Constants |
Parts per million + prism constant |
52 |
Measurements |
Number of measurements + standard deviation |
53 |
Deviation |
Deviation value (sub-codes: 531 = atmospheric correction/pressure, 538 = coefficient of refraction) |
58 |
Signal Strength |
EDM signal strength / prism constant |
59 |
Prism Constant |
Reflector constant (1/10 mm) / PPM |
71 |
Point Code |
Feature code |
72–79 |
Attributes 1–8 |
User-defined attribute fields |
81 |
Target Easting |
E coordinate of target point |
82 |
Target Northing |
N coordinate of target point |
83 |
Target Elevation |
H (height) of target point |
84 |
Station Easting |
E coordinate of instrument station |
85 |
Station Northing |
N coordinate of instrument station |
86 |
Station Elevation |
H (height) of instrument station |
87 |
Reflector Height |
Prism/target height above ground mark |
88 |
Instrument Height |
Instrument height above ground mark |
3.1.6. Special Record Types
Station setup records
A line that contains station coordinate words (WI 84, 85, 86) but does not contain horizontal or vertical angle words (WI 21, 22) is interpreted as a station setup record. This marks the beginning of a new instrument station. In the grid, station setup rows are highlighted with a light blue background.
Set-of-angles (SOA) result lines
Lines starting with WI 41 that contain names such as HZ-RESLT, HZ-MEAN0,
or HZ-DIFF0 are Leica’s internal averaging results from set-of-angles
measurements. These lines are displayed in the grid with a light gray background
and are read-only (not editable).
Face I / Face II detection
The editor determines the telescope face from the vertical angle (WI 22):
Face I: Vz < 200 gon
Face II: Vz >= 200 gon
3.1.6.1. Opening the GSI Editor
The GSI Editor is accessed from the application sidebar:
In the main SurveyTools window, expand the Tools section in the left sidebar.
Click GSI Editor.
The editor opens with an empty grid and two tabs at the top: Data (the measurement grid) and Options (format and unit settings).
3.1.6.2. Opening GSI Files
To load a GSI file into the editor:
Click the Open button in the toolbar at the top of the editor.
In the file dialog, select one or more
.gsifiles. The dialog accepts both GSI8 and GSI16 files.Click Open. The file contents are decoded and displayed in the grid.
The editor automatically detects whether each file uses GSI8 or GSI16 encoding based on the word length (15 or 23 characters per word). The detected format is shown in the Options tab under the GSI Format radio group.
Note
You can open multiple GSI files. Each file loads into the same data grid. Use the Options tab to verify that the detected format matches your expectations.
3.1.6.3. Understanding the Grid
The data grid presents decoded GSI data in a spreadsheet-like view with 22 columns. Each row corresponds to one line (record) in the original GSI file.
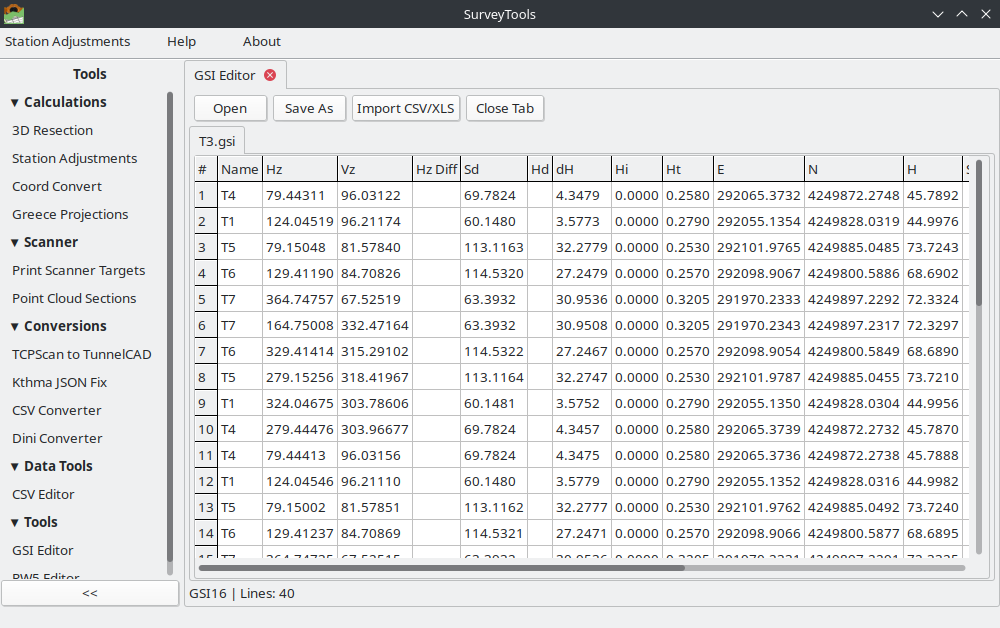
The columns, listed in display order, are:
Column Header |
WI Code |
Data Type |
Contents |
|---|---|---|---|
Point Name |
11 |
Text |
Target point identifier (leading zeros stripped) |
Station Point Number |
16 |
Text |
Station point name |
Horizontal Angle |
21 |
Float |
Horizontal circle reading (gon) |
Vertical Angle |
22 |
Float |
Zenith/vertical angle (gon) |
Slope Distance |
31 |
Float |
Slope distance (m) |
Horizontal Distance |
32 |
Float |
Horizontal distance (m) |
Height Difference |
33 |
Float |
Height difference (m) |
Atmos.Correction: pressure |
531 |
Float |
Atmospheric correction (pressure) |
Coefficient refraction |
538 |
Float |
Refraction coefficient |
Prism Constant |
58 |
Float |
EDM signal strength / prism constant |
PPM |
59 |
Float |
Parts per million correction |
X (Easting) |
81 |
Float |
Target easting coordinate |
Y (Northing) |
82 |
Float |
Target northing coordinate |
Z (Elevation) |
83 |
Float |
Target elevation |
Station Easting |
84 |
Float |
Station easting coordinate |
Station Northing |
85 |
Float |
Station northing coordinate |
Station Height |
86 |
Float |
Station elevation |
Reflector Height |
87 |
Float |
Target/prism height above mark |
Instrument Height |
88 |
Float |
Instrument height above mark |
Date |
17 |
Text |
Measurement date |
Time |
19 |
Text |
Measurement time |
The footer row at the bottom of each column displays the GSI word index code for reference.
3.1.6.3.1. Grid Features
The grid supports several built-in operations via keyboard shortcuts:
Shortcut |
Action |
|---|---|
Ctrl+F |
Open the Find dialog to search within the grid |
Ctrl+G |
Show/hide column visibility dialog |
Ctrl+T |
Open the filter dialog |
Ctrl+S |
Open the sort dialog |
Ctrl+A |
Select all rows |
Ctrl+K |
Optimize (auto-fit) column widths |
Ctrl+C |
Copy the value of the current cell |
3.1.6.4. Editing Values
The grid supports direct in-cell editing. To modify a value:
Click on the cell you want to edit. The cell enters edit mode.
Type the new value.
Press Enter or Tab to confirm, or Escape to cancel.
Pressing Tab advances the cursor to the next column (left to right, then down to the next row).
3.1.6.4.1. Validation Rules
The editor validates input according to the data type:
Field Type |
Rule |
|---|---|
Horizontal Angle (WI 21) |
Must be a number in the range 0 to 400 gon |
Vertical Angle (WI 22) |
Must be a number in the range 0 to 400 gon |
Distances (WI 31, 32, 33) |
Must be a non-negative number (>= 0) |
Point Names (WI 11, 16) |
Text; maximum length depends on format (8 chars for GSI8, 16 chars for GSI16) |
Coordinates (WI 81–88) |
Must be a valid floating-point number |
Warning
Cells that fail validation are highlighted with a red background. You must correct invalid values before saving or exporting the file. The editor will not prevent you from navigating away from an invalid cell, but the red highlight serves as a persistent reminder.
3.1.6.5. Row Colors
The grid uses background colors to distinguish different record types at a glance:
Color |
Meaning |
|---|---|
Light blue |
Station setup record. This row defines a new instrument station (contains WI 84/85/86 but no WI 21/22). |
Light gray |
Set-of-angles (SOA) result. Leica internal averaging line (e.g.,
|
White |
Normal measurement observation. Fully editable. |
Red cell |
Individual cell with an invalid value that fails validation. |
3.1.6.6. Saving and Exporting
To save or export the current data:
Click the Export button in the toolbar.
In the Save dialog, choose the output location and filename.
Select the desired format from the file type dropdown:
GSI16 (
.gsi) – Leica GSI-16 formatGSI8 (
.gsi) – Leica GSI-8 formatXLSX (
.xlsx) – Microsoft Excel spreadsheetCSV (
.csv) – Comma-separated values
Click Save.
The file extension is set automatically based on the selected format.
Note
When exporting to XLSX or CSV, all columns in the grid are included. Column headers are written as the first row. This is useful for creating reports or importing the data into other software.
3.1.6.7. Importing from a Spreadsheet
The GSI Editor can import measurement data from CSV or XLSX files and convert them to GSI format using a 3-step wizard.
3.1.6.7.1. Step 1: File Selection
Launch the import wizard from the toolbar.
Browse to and select the source CSV or XLSX file.
A preview of the first few rows is displayed so you can verify the file was read correctly.
3.1.6.7.2. Step 2: Column Mapping
Map each column in the source spreadsheet to the corresponding GSI word index:
Use the dropdown menus to assign each source column to a GSI field (Point Name, Hz Angle, Vz Angle, Slope Distance, etc.).
Columns that do not correspond to a GSI field can be left unmapped (skipped).
3.1.6.7.3. Step 3: Summary and Import
Review the mapping summary showing which source columns map to which GSI fields.
Confirm the import. The data is loaded into the grid.
You can then edit the imported data and export it in any supported format.
3.1.6.8. Working with Multiple Files
The editor supports opening multiple files into the same data grid. Each call to Open appends the new file’s records to the existing grid contents.
Note
To start with a clean grid, close and reopen the GSI Editor before loading a new file.
3.1.6.9. Typical Workflows
3.1.6.9.1. Convert GSI to Excel
Open the GSI Editor from Tools > GSI Editor.
Click Open and select your
.gsifile.Verify the decoded data in the grid. Check the Options tab to confirm the correct format and units were detected.
Click Export, choose XLSX as the format, and save.
3.1.6.9.2. Edit Point Names
Open the GSI file in the editor.
Navigate to the Point Name column (first column).
Click on the cell for the point you want to rename and type the new name.
Repeat for additional points as needed.
Click Export and save as GSI16 or GSI8 to write the updated file.
3.1.6.9.3. Convert GSI8 to GSI16
Open a GSI8 file. The editor auto-detects the format.
Go to the Options tab and select GSI 16.
Click Export and save. The output file uses 16-character data words.
3.1.6.9.4. Import CSV and Save as GSI
Open the GSI Editor.
Launch the import wizard and select your CSV file.
Map the CSV columns to GSI fields (e.g., column A = Point Name, column B = Hz Angle).
Confirm the import. The data appears in the grid.
Go to the Options tab and select the desired GSI format (GSI8 or GSI16) and units.
Click Export and save as
.gsi.
3.1.6.9.5. Inspect Station Setups
Open a GSI file containing multiple station setups.
Scan the grid for rows highlighted in light blue – these are station setup records.
Check the Station Easting, Station Northing, and Station Height columns (WI 84, 85, 86) to verify station coordinates.
The Instrument Height column (WI 88) shows the height of instrument above the ground mark for each station.
3.1.6.9.6. Verify Face I / Face II Observations
Open the GSI file and examine the Vertical Angle column (WI 22).
Values less than 200 gon indicate Face I observations.
Values of 200 gon or greater indicate Face II observations.
Use this to confirm that dual-face measurements are present before processing set-of-angles reductions.
3.1.6.10. GSI Format Worked Example
Below is a sample GSI16 file with three records: one station setup and two target observations.
*110001+0000000000STNA01 84..06+0000000004578321 85..06+0000000002345678 86..06+0000000000123456 88..06+0000000000015230
*110002+00000000000000P1 21.022+0000000012345600 22.022+0000000009523400 31..00+0000000000125340 87..06+0000000000016500
*110003+00000000000000P2 21.022+0000000045678900 22.022+0000000010034500 31..00+0000000000098760 87..06+0000000000016500
Line 1 (Station setup):
*110001+0000000000STNA01– WI 11, point name =STNA0184..06+0000000004578321– WI 84, station easting = 457.8321 m (units code 6, 1/10 mm)85..06+0000000002345678– WI 85, station northing = 234.5678 m86..06+0000000000123456– WI 86, station elevation = 12.3456 m88..06+0000000000015230– WI 88, instrument height = 1.5230 mNo WI 21 or 22 present, so this is identified as a station setup record.
Line 2 (Observation to P1):
*110002+00000000000000P1– WI 11, point name =P121.022+0000000012345600– WI 21, Hz angle = 123.45600 gon (units code 2)22.022+0000000009523400– WI 22, Vz angle = 95.23400 gon (Face I, since < 200)31..00+0000000000125340– WI 31, slope distance = 125.340 m (units code 0)87..06+0000000000016500– WI 87, reflector height = 1.6500 m
Decoding the word 21.022+0000000012345600:
Position |
Value |
Meaning |
|---|---|---|
1–2 |
|
Word Index: Horizontal angle |
3 |
|
Auto-index: OFF |
4 |
|
Input mode: measured |
5 |
|
Additional info |
6 |
|
Units: gradians (5 decimal places) |
7 |
|
Sign: positive |
8–23 |
|
Raw value: 12345600, divided by 10^5 = 123.45600 gon |
3.1.6.11. References
Leica Geosystems – GSI Online for Leica TPS, instrument documentation
Total Open Station – GSI format description: https://totalopenstation.readthedocs.io/en/stable/input_formats/if_leica_gsi.html
Jaison’s Blog – Leica GeoSystem File Format (GSI File): https://jaisonjustus.wordpress.com/2011/02/13/leica-geosystem-file-format-gsi-file/